Built to Integrate: Why Qpoint's Modular Architecture Matters


When we started building Qpoint, we faced a critical architectural decision: should we create an all-in-one platform that tries to solve every problem, or should we build something more fundamental that could adapt to how real engineering teams actually work?
We chose modularity. Here's why that matters.
The Problem with "Complete Solutions"
Most security and observability vendors want you to adopt their entire stack. They'll give you visibility, but only if you route all your traffic through their proxy. They'll provide dashboards, but only if you store your data in their cloud. They'll offer analysis, but only if you let them see your sensitive payloads.
This creates an impossible choice for security and platform teams: accept vendor lock-in and loss of data control, or remain blind to what's happening in your encrypted traffic.
We built Qpoint differently.
Three Components, Three Choices
Qpoint's architecture separates concerns at a fundamental level:
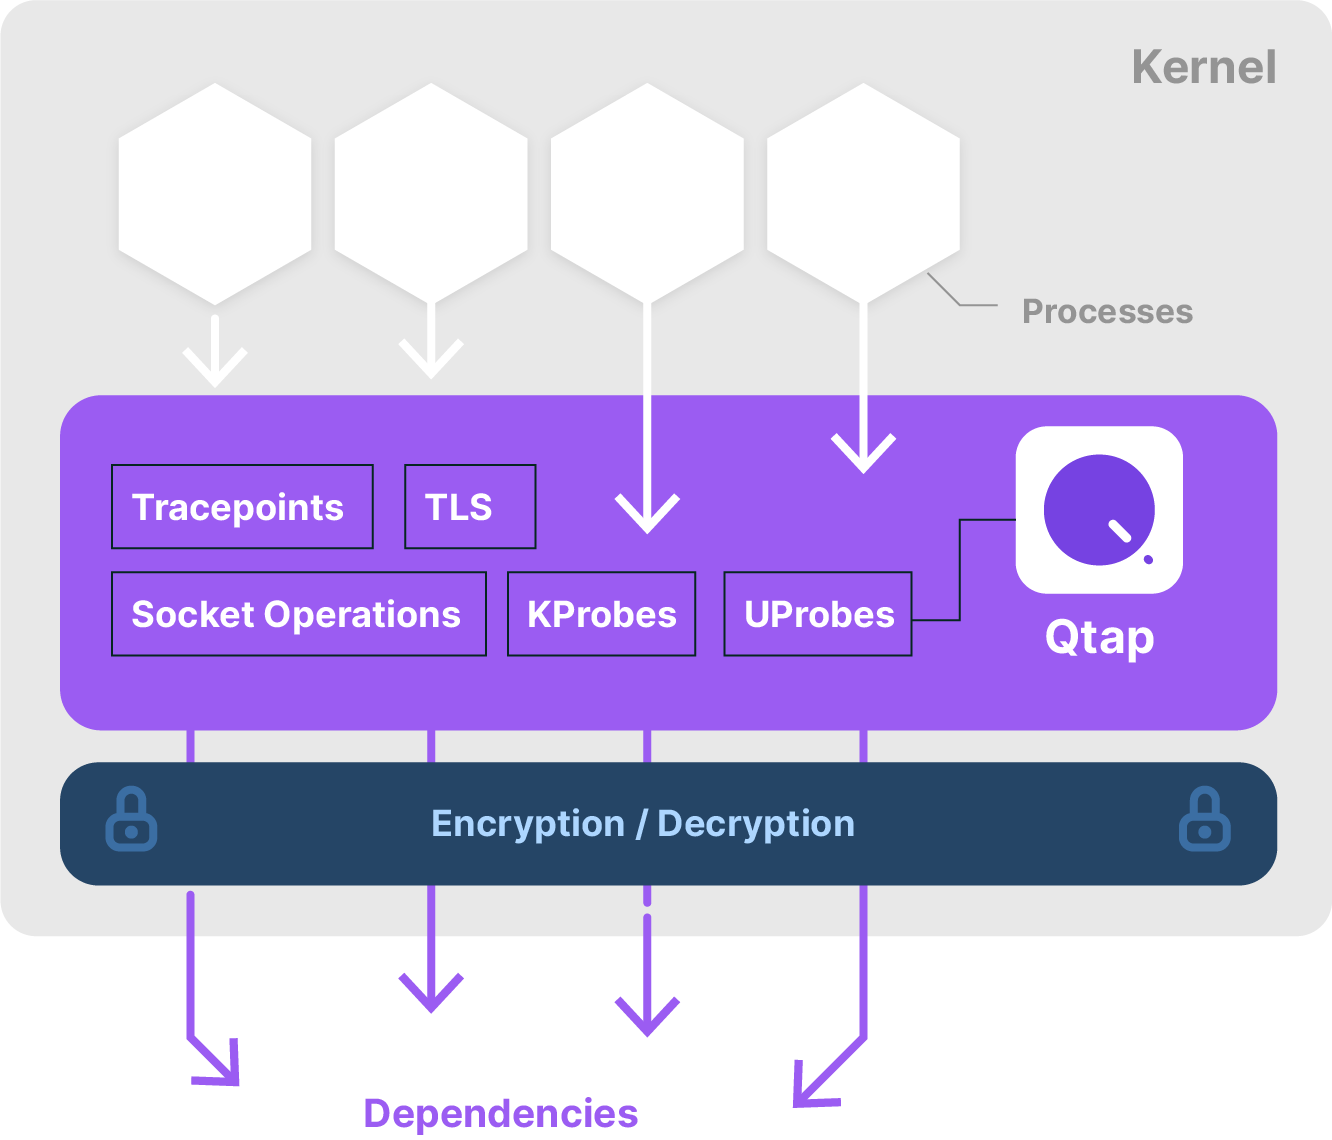
QTap: The Data Plane
A lightweight eBPF agent that captures traffic at the Linux kernel level. QTap operates at two distinct layers: the socket layer (capturing connection metadata through kernel probes) and the TLS layer (intercepting payloads before encryption). QTap is the foundation of everything and can run completely standalone with just a YAML configuration file. No account required. No phone-home behavior. No external dependencies. This is where the actual visibility happens.
QPlane: Optional Centralized Management
A cloud-hosted management interface at app.qpoint.io that provides centralized configuration, dashboards, alerting, and team collaboration. QPlane is entirely optional. Many teams run QTap standalone and never use QPlane. But when you do connect QTap agents to QPlane, you get powerful features like real-time analytics and multi-environment visibility. Crucially, QPlane only ever sees anonymized connection metadata. The sensitive payload data stays in your environment.
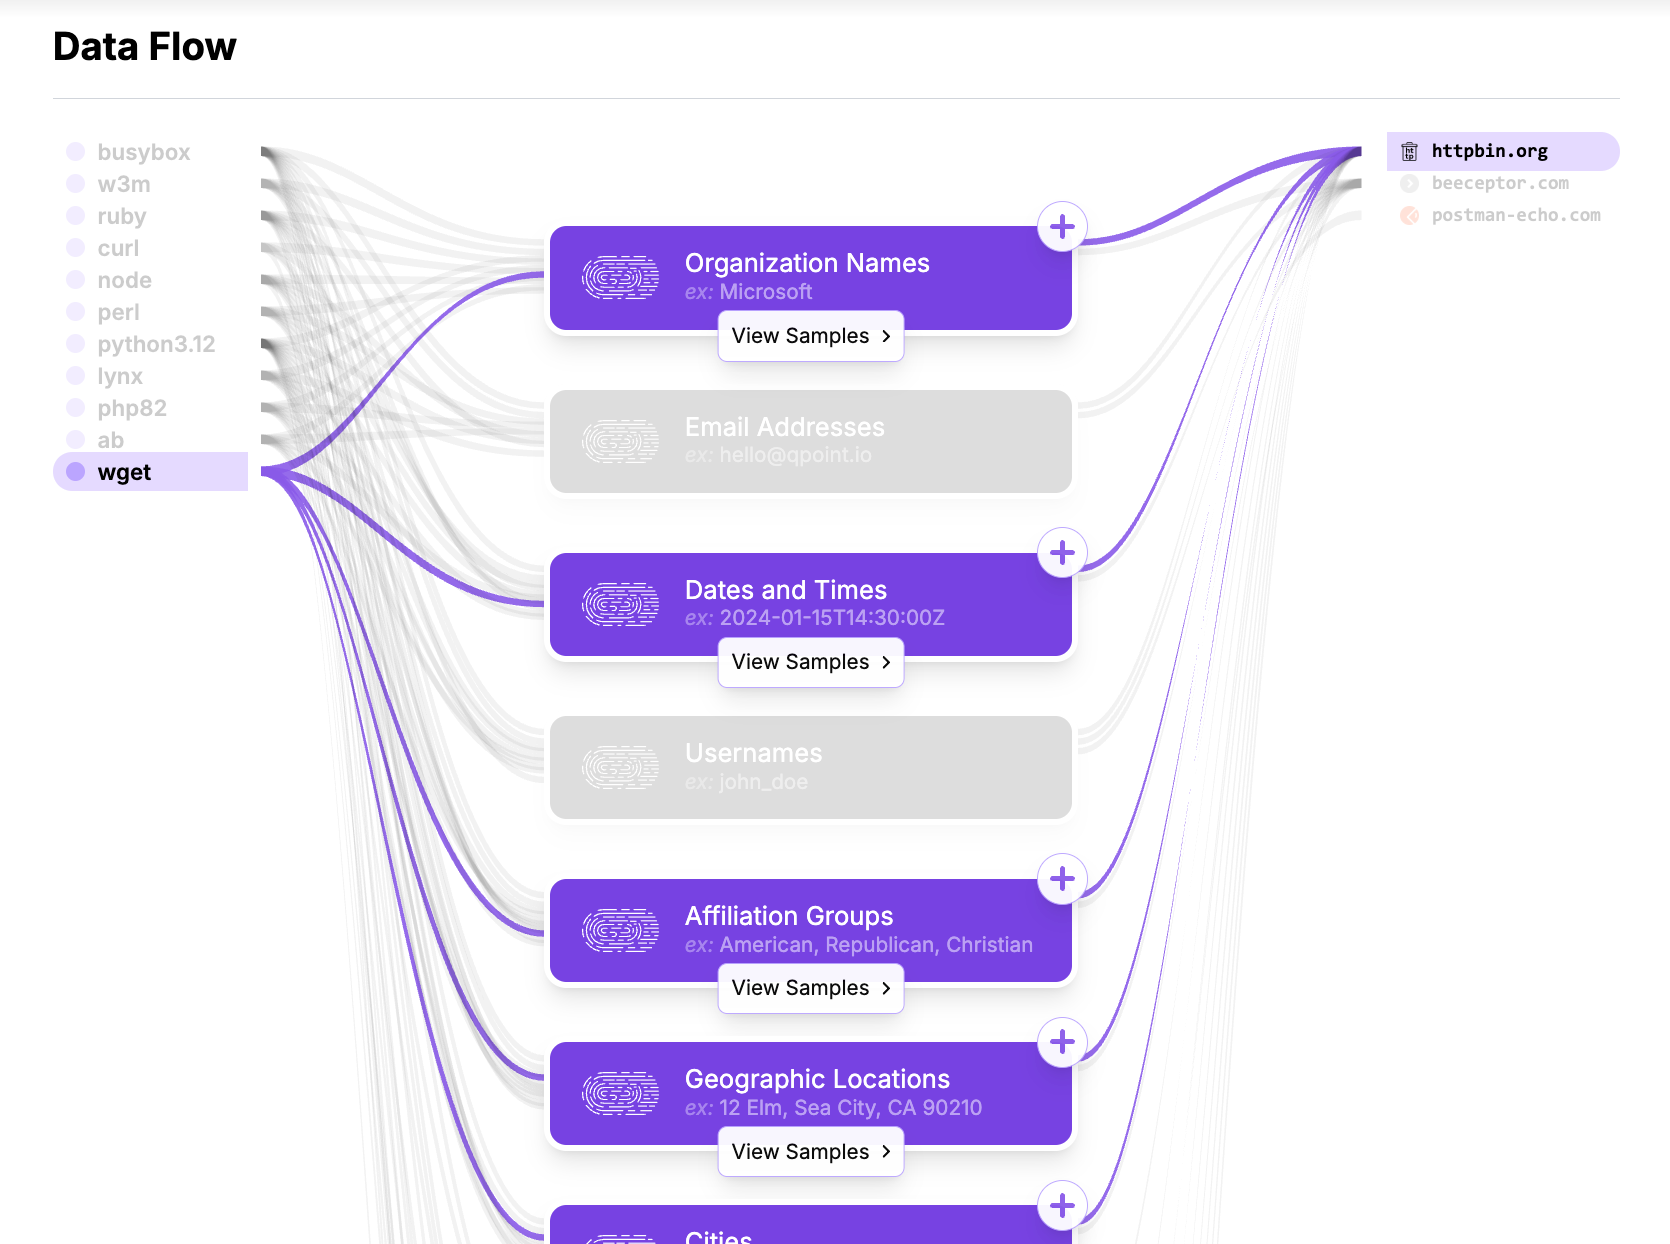
QScan: Optional Data Classification
A Docker container you run in your own infrastructure that uses Microsoft Presidio to identify 20+ types of sensitive data in captured traffic. QScan processes payloads entirely within your control. Whether you use it depends on your needs.
The key insight: QTap is the product. QPlane and QScan are optional enhancements. You get instant visibility into encrypted traffic from day one, with or without any other components.
Data Sovereignty by Design
QTap captures two distinct types of data, each with independent storage configuration:
Events (connection metadata): Anonymized information about connections including timestamps, endpoints, performance metrics, and HTTP transaction summaries. This data is generally not sensitive but provides powerful analytics and troubleshooting insights.
Objects (payload content): Actual request and response data including headers and bodies, which may contain sensitive information. Objects are selectively captured based on your plugin configuration, giving you fine-grained control over what gets stored.
This separation is architecturally fundamental. You can route events to centralized analytics platforms while keeping objects in your own S3-compatible storage. Or send both to stdout during development. Or store everything locally in air-gapped environments. The choice is yours.
Storage Options for Events:
- Console output (stdout) for immediate visibility
- Axiom for advanced analytics and visualization
- OpenTelemetry (OTLP) for any OTLP-compatible backend (Datadog, Honeycomb, New Relic, Grafana Cloud)
- Your existing observability pipeline via standard log formats
Storage Options for Objects:
- Console output (stdout) for development
- Any S3-compatible storage: AWS S3, MinIO, Google Cloud Storage, Backblaze B2, Wasabi
- Local filesystem for air-gapped environments
- Your own storage infrastructure with custom access URLs
The architecture makes no assumptions about your storage or processing infrastructure. You own the data flow from kernel capture to final destination. This means you can integrate Qpoint's unmatched visibility into whatever observability, security, or compliance workflows you already have running.
Deployment Flexibility
The modular architecture enables deployment patterns that match how real organizations operate:
Emergency Debugging with QTap DevTools
Enable QTap DevTools with a single flag (--enable-dev-tools) for instant browser-based traffic inspection on localhost:10001. No service restarts. No code changes. No proxies. Perfect for production incident response when you need to see what's actually happening right now. All data stays local on the server you're debugging. DevTools runs alongside any other QTap configuration, giving you real-time visibility without disrupting your existing capture and storage setup.
Air-Gapped Environments
Run QTap standalone with YAML configuration. No external connectivity required. Perfect for highly regulated industries or environments with strict data residency requirements. You still get instant visibility into encrypted traffic, process attribution, and flexible traffic processing. Send data to stdout, local storage, or your internal log aggregation infrastructure.
Distributed Self-Managed
Deploy QTap agents across on-prem data centers and multiple cloud providers, each with its own YAML configuration. Manage configurations through Git and deploy through your CI/CD pipelines. You get unified visibility into traffic patterns without any centralized control plane. Data flows to your storage and observability infrastructure.
Optional Centralized Management
If centralized dashboards and team collaboration become important, connect your QTap agents to QPlane. Once connected, QPlane manages your agent configurations through its cloud control plane. Configuration changes propagate automatically to all agents, giving you a unified view across your infrastructure while keeping sensitive data in environment-specific storage. This is a deliberate choice between local YAML management (GitOps-friendly) and centralized cloud control (dashboard-driven).
Progressive Adoption
Start with QTap running locally, outputting to stdout for immediate visibility. Enable DevTools when you need to debug a specific issue. Add S3 storage when you're ready to retain payloads. Integrate with OpenTelemetry when you want to route data to your existing observability stack. Optionally connect to QPlane when you need centralized management and dashboards. Enable QScan when compliance requires sensitive data classification. Each step adds capability without forcing re-architecture.
Developer-Friendly Workflows
Developers can test with minimal YAML configurations locally, then production deployments use the same core technology but with richer processing configurations and storage options. The learning curve is gentle because the foundation stays consistent.
Integration Points
Modularity means Qpoint fits naturally into your existing ecosystem rather than requiring you to rebuild around it:
Observability Pipelines
QTap outputs structured events that feed directly into your existing observability stack. Route connection events and HTTP transaction data to OpenTelemetry collectors, then to Datadog, Honeycomb, New Relic, Grafana Cloud, or Elastic. Send to Axiom for advanced analytics. Or integrate with your existing log aggregation infrastructure. You're not replacing your observability tools; you're enhancing them with unmatched visibility that other tools can't provide. The data format is yours to define, and the destination is yours to control.
Security Tools
Captured events and classified sensitive data can trigger actions in your SIEM, ticketing systems, or incident response platforms. The audit trail of sensitive data flows becomes evidence for compliance teams, feeding directly into your existing GRC workflows. Because QTap outputs standard formats (OpenTelemetry logs, structured JSON), integration is straightforward.
Storage and Compute
Use any S3-compatible storage: AWS S3, Google Cloud Storage, MinIO, Wasabi, Backblaze B2. Run QScan wherever makes sense: in your VPC, on-premises, in a Kubernetes cluster. Deploy QTap on bare metal, VMs, or containers. The architecture doesn't dictate your infrastructure choices.
CI/CD and GitOps
QTap's YAML configuration is version-controlled infrastructure-as-code. For standalone deployments, commit configurations to Git, test changes in staging, and deploy through your existing CI/CD pipelines. You manage QTap entirely through YAML files.
If you connect to QPlane, the cloud control plane manages your agent configurations. QPlane's Snapshot YAML feature lets you download your current configuration from the UI and commit it to version control for backup or templating purposes, but active configuration management happens either through local YAML files or through QPlane - not both simultaneously.
The Real-World Impact
This modularity matters because real environments are messy. You might have:
- A payment service that needs full payload capture and PII detection
- Internal microservices where you only need connection-level visibility
- A third-party integration that requires detailed error logging
- Compliance requirements that mandate certain data stays on-premises
- A security team that wants centralized dashboards
- A platform team that wants to own their configuration in Git
With Qpoint's modular architecture, you can satisfy all these requirements simultaneously. You're not forced into compromises because the architecture doesn't impose artificial constraints.
What We Learned
Building Qpoint as a modular system required more upfront architectural work than building a monolithic platform. But this investment pays off every time we work with a new customer.
When companies with strict data residency requirements evaluate us, the separation between events and objects means they can get centralized visibility while keeping all payloads in their own infrastructure.
When teams want to integrate Qpoint into their existing observability stack, the flexible data output options mean they can feed data into their existing pipelines without replacing tools that are already working.
When customers in highly regulated industries need to prove compliance, the ability to run QTap completely standalone in air-gapped environments means we can still provide value despite their restrictions.
None of these scenarios would have worked with a monolithic "take it all or leave it" approach.
The Broader Principle
Modularity in security tooling reflects a fundamental respect for the complexity of real engineering environments.
Your infrastructure isn't homogeneous. Your requirements aren't universal. Your data isn't all equally sensitive. Your team doesn't all work the same way.
Any tool that pretends otherwise is trying to simplify reality rather than work within it.
We built Qpoint to work within the reality of modern infrastructure: messy, distributed, heterogeneous, and constantly evolving. The modular architecture means you can adopt what makes sense for your specific context, integrate with what you already have, and change your mind later without major disruption.
Try It Yourself
Want to see this modularity in action?
Start Standalone
Deploy QTap with a minimal YAML configuration that outputs to stdout. Five minutes to visibility with zero dependencies. No account required. 5-Minute Quickstart
Add Capabilities Progressively
Follow our Complete Guide that walks through four levels of configuration: basic stdout logging, S3 storage, integration with your observability stack, and production-ready configurations with conditional capture. All without requiring QPlane. Complete Guide
Or Optionally Try Centralized Management
If you want to explore centralized dashboards and team collaboration, deploy with QPlane in 10 minutes. You still maintain data sovereignty through the architectural separation. POC Kick Off Guide
The choice is yours. That's the (q)point.