Introducing DevTools: Chrome-style Network Tab for Your Linux Server

If you've ever spent hours debugging a production issue only to realize the problem was hiding in an API call you couldn't see, this post is for you.
Developing QTap has been one of the most exciting and rewarding projects many of us have worked on. We've spent months obsessing over eBPF performance, protocol parsing, and kernel safety. But today I want to tell you about something that started as a side quest, and turned into something we think every developer needs.
The Debugging Problem Nobody Talks About
Here's the scene: You're on a production server. Something's broken. You need to see what your application is actually receiving or sending to that third-party API.
So you reach for your trusty tools:
tcpdump? Great, except everything is encrypted. You get hex dumps and the satisfying knowledge that something is happening.
Wireshark? Same problem. TLS is doing its job a little too well.
Proxy it through a MITM proxy? Now you've introduced latency, a bottleneck, a single point of failure, and you're managing certificates. You're also reconfiguring your application, and hoping you didn't just introduce a new bug while debugging the old one.
Add some logging? Sure, but now you need to redeploy. And you're only logging what you thought to log. The thing you need to see is probably the thing you didn't think to capture.
This is the debugging tax we've all learned to accept. The moment HTTPS enters the picture, visibility disappears. You're left guessing, adding print statements, and playing twenty questions with your own code.
We Built This for Ourselves First
As we developed QTap, we found ourselves doing excruciating amounts of testing. We needed a way to visually confirm the traffic on a single node to ensure we were capturing and attributing exactly what we claimed we were.
We tried the usual approaches. None of them gave us what we needed: a simple, browser-based view of http/s traffic in plaintext from a live server.
So we built it.
We all grew up with the Chrome Network tab. That familiar interface where you can see every request, click to expand headers and bodies, watch timing waterfall down the screen. We wanted that exact experience, but for server-side traffic.
DevTools started as an internal tool. A way to validate QTap's output. A debugging companion we could fire up during development.
But the more we used it, the more we realized: this isn't just useful for building QTap. This is useful for building anything.
What DevTools Actually Does
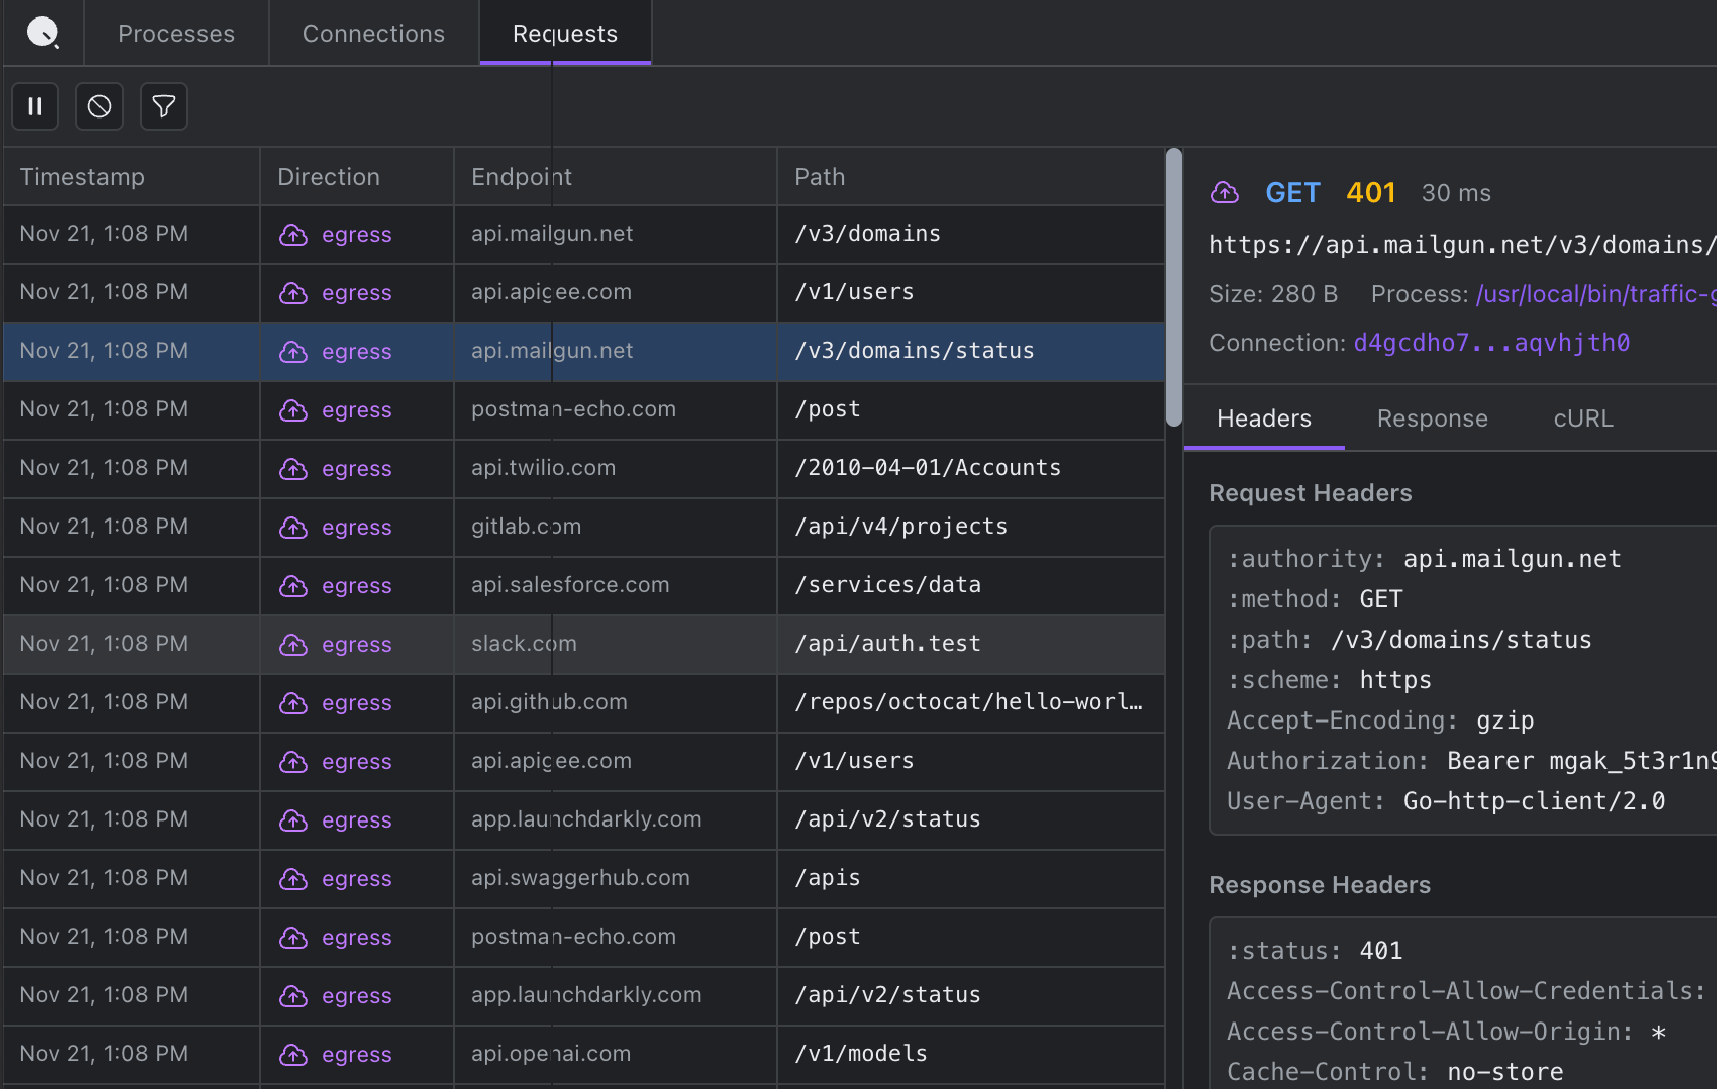
QTap DevTools gives you a browser-based interface showing all HTTP/S traffic on a Linux host. In real-time. With full plaintext visibility.
No proxies. No certificates. No code changes. No restarts.
You install QTap, enable DevTools, and open localhost:10001 in your browser. Every HTTP/S request and response flows through the interface as it happens: headers, bodies, timing, status codes, everything.
The magic is eBPF. QTap hooks into TLS libraries before encryption occurs, capturing traffic at the source. It's the same approach we use for our commercial platform, but packaged into something you can run locally in under a minute.

Some things you can do with it:
- See the actual request your app sent, not what your logging framework decided to capture
- Debug authentication failures by seeing exactly what credentials were transmitted
- Trace container traffic and know exactly which container made which request
- Copy any request as cURL to reproduce issues instantly
- Watch connections in real-time as Server-Sent Events stream new requests as they happen
The "Aha" Moments
Every time we show DevTools to a developer, there's a moment. Usually it's within the first thirty seconds.
"Wait, I can see inside HTTPS without setting up certificates?"
Yes.
"And this works on any application? Any language?"
If it uses a supported TLS library, yes. Node, Python, Java, Go, Ruby, all the major languages work.
"And I don't have to restart anything?"
Nope. Just run QTap on the server and open the browser interface.
The reaction is always the same mix of relief and mild frustration. Relief that this exists, frustration that it didn't exist years ago.

Free and Open Source
We're releasing QTap DevTools as free and open-source software under the AGPL-3.0 license.
Why? Because basic visibility into your own traffic shouldn't require an enterprise contract. If you're a developer trying to debug an API integration at 2am, you shouldn't need a budget approval to see what your code is actually sending.
We believe that open-sourcing DevTools is the right thing to do. The community deserves better debugging tools, and we want to build them alongside you.
QTap Pro is available under a commercial license if you need additional features or different licensing terms, but the core DevTools functionality is free for everyone.
Getting Started
Installation takes about 60 seconds:
# Install
curl -s https://get.qpoint.io/install | sudo sh

# Run
sudo qtap --enable-dev-tools

# Connect
open http://localhost:10001
That's it. Open your browser and you're watching traffic.
For more details, check out the full documentation or explore the code on GitHub.
What's Next
This is the beginning of what we hope will be a valuable tool for developers everywhere. We're actively working on expanding protocol support like PostgreSQL, MySQL, Redis, Kafka, DNS, and more.
We'd love your feedback. Open an issue, submit a PR, or just let us know what you'd like to see. We built this for ourselves first, but now we're building it for all of us.
Happy debugging,
Tyler Flint
Co-founder & CEO, Qpoint
Ready to try it? View QTap on GitHub or check out the DevTools product page for more details.