The Hidden Complexity of External Dependencies - How Qpoint Solves a Cloud-scale Problem


When building and operating large-scale systems, there's a critical truth we often underestimate: your system is only as reliable as its weakest dependency. Let's dive into a real-world scenario where this becomes painfully evident, and how a tool like Qpoint addresses this fundamental challenge.
The Reality of "You Build It, You Run It"
During my time at a major cloud provider building a Platform-as-a-Service product, our team operated under what's now commonly called a DevOps or "you build it, you run it" model. This wasn't just a catchy phrase—it had real implications:
- Development teams that built a product also owned and operated it
- Engineers rotated through on-call duty, responsible for responding to incidents
- We monitored resource usage, network traffic, and system health
- Operations teams handled baseline monitoring, but engineers were paged in for anything notable
This approach had tremendous benefits. Our team of talented engineers brought a genuine passion for building robust, reliable systems. Operational excellence wasn't just a buzzword—it was baked into our team culture.
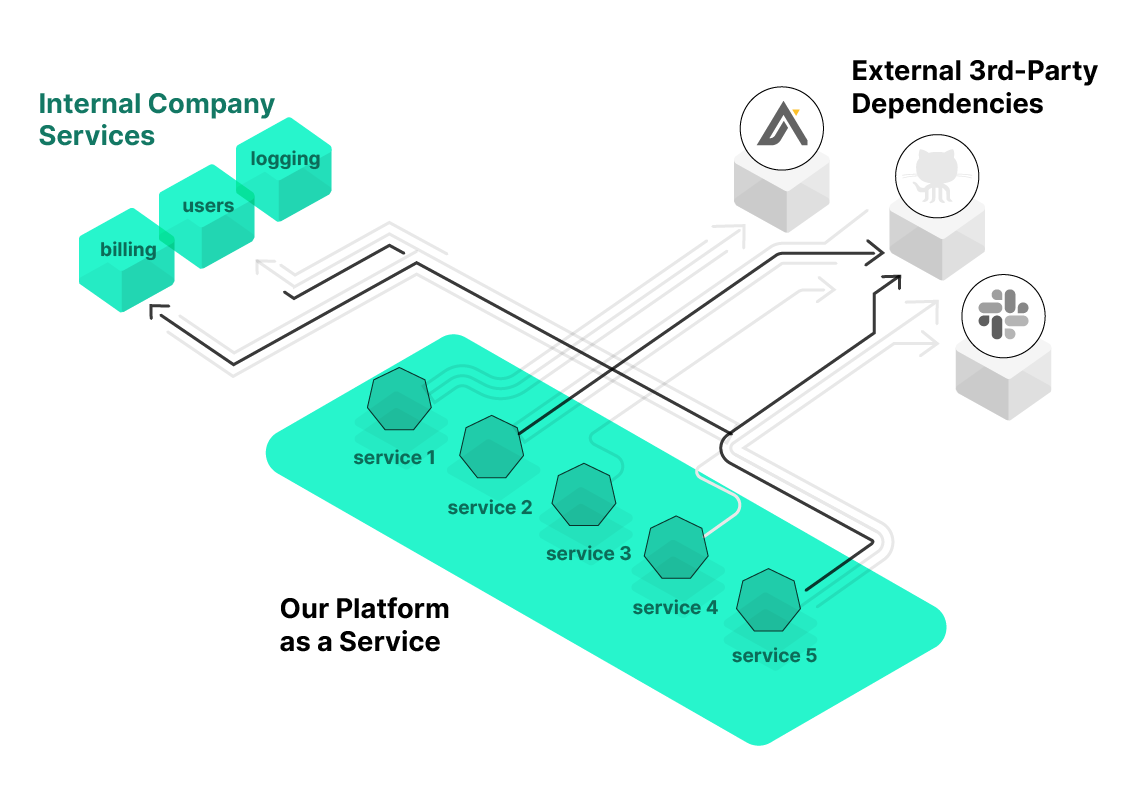
Let's say we have a system that looks something like this:

But here's the problem we confronted: operating a cloud platform at scale involves a complex web of dependencies, both internal and external.
The Dependency Nightmare
Let's break down what these dependencies looked like:
- Internal services: User management, billing systems, databases, etc.
- External APIs: Cloudflare, Github, Sentry, and numerous other third-party services
What became painfully clear was that all of these services experienced periods of instability. Sometimes subtle, sometimes catastrophic. This created a persistent challenge: how do we quickly determine if the problem is in our system or in a dependency?
Our initial solution was to build extensive monitoring for these external services, but this approach came with significant downsides:
- It cluttered our system domain logic with monitoring code
- It required building monitoring systems that operated independently of our main system
- It demanded significant engineering investment
- It meant more code to maintain outside of core business needs
- It created more systems to operate (yes, more on-call alerts!)
This is a reminder to myself: the cost of this approach goes beyond just the initial implementation. It's the ongoing maintenance burden that really adds up.
The Breaking Point
Let's look at how this played out in practice. Imagine a scenario where deployments suddenly started failing:
func main() {
    // Customer initiates a deployment
    deployment := InitiateDeployment(customerApp)

    // Fetch code from GitHub
    sourceCode, err := github.FetchRepository(deployment.RepoURL)
    if err != nil {
        // Is GitHub down? Is our token expired? Is our code buggy?
        // Who knows! Time to start a complex investigation...
        log.Fatalf("Deployment failed: %v", err)
    }

    // Continue with deployment process...
}
When this fails, we'd start a complex investigation:
- Check our system logs
- Look for any recent code changes
- Verify our GitHub credentials
- Check GitHub status page
- Test API access from different locations
- Correlate with other GitHub-dependent systems
All of this investigation takes precious time while customers wait for their deployments to work again.
Enter Qpoint: A Better Approach
Qpoint aims to remove this entire class of problems by providing immediate visibility into external dependencies. Instead of building custom monitoring solutions, Qpoint offers:
- Immediate detection when there's an issue with a third-party system
- Contextual information to determine if it's a service outage on their end or an issue on yours
- Deep insights into any breaking changes between services
- Comprehensive data to understand the core problem
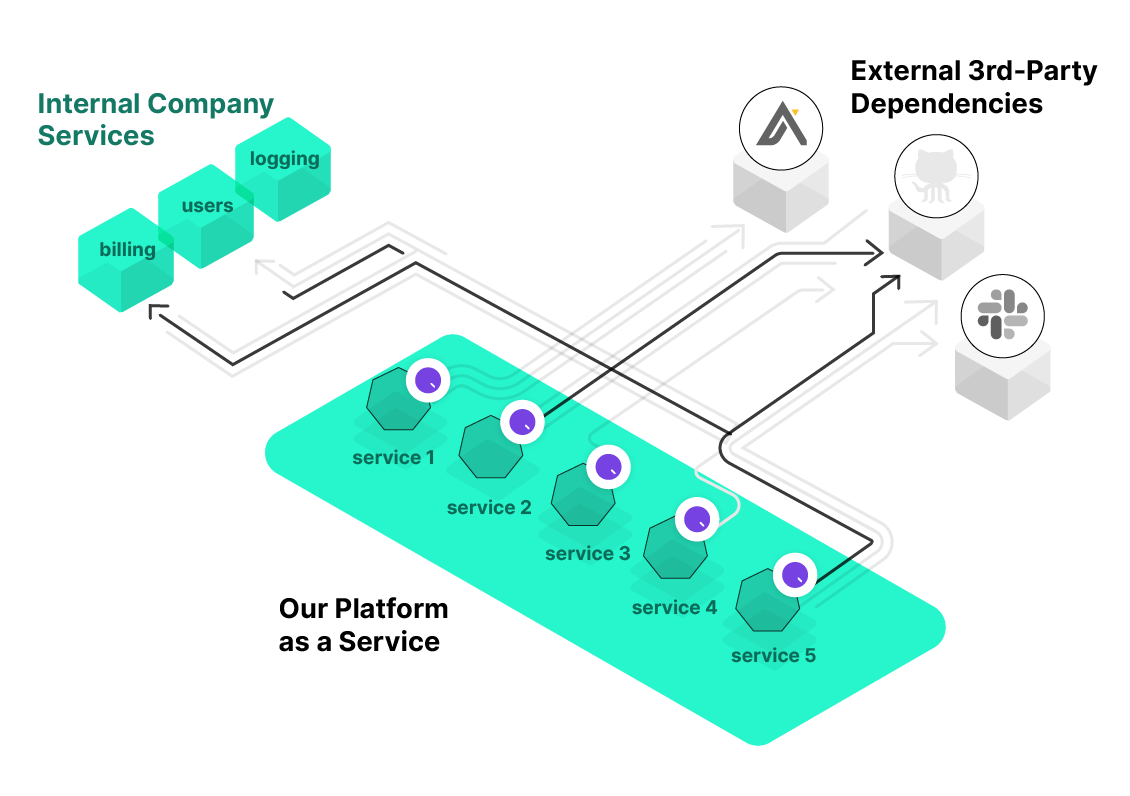
All without making any source code changes! Let's see how this changes our approach:
How Qpoint Works: A Brief Technical Look
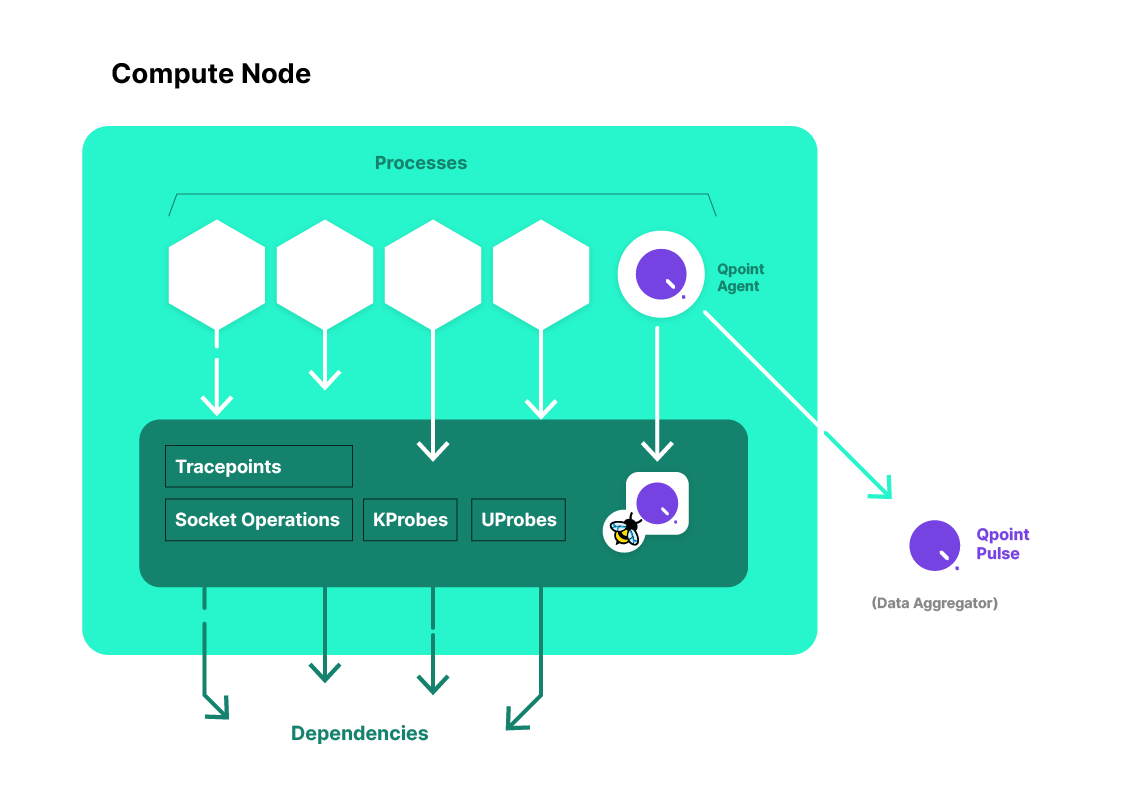
Qpoint takes a novel approach by using eBPF (Extended Berkeley Packet Filter) technology to gain visibility directly at the source of each connection. Let's break down how this actually works:
- Qpoint Agent Deployment: The Qtap agent is installed directly on your application hosts. This can be deployed as:
- A Linux binary
- A Docker container
- A Kubernetes deployment via Helm chart
- eBPF Magic: The agent uses eBPF to hook into the kernel and monitor network socket operations. This lets Qpoint:
- See which specific processes are making external calls
- Monitor traffic before encryption happens
- Collect both metadata and actual payloads
- Do all this with minimal overhead
- Payload Visibility: This is where things get really interesting. Qpoint can capture the actual content of requests and responses through:
- Native TLS Integration: Works automatically with OpenSSL, GoTLS, and NodeTLS
- Egress Controller: For other runtimes, using a local proxy with transparent redirection
Let's see how this works with our previous GitHub example:
// Your normal application code doesn't change:
func main() {
    // Customer initiates a deployment
    deployment := InitiateDeployment(customerApp)

    // Fetch code from GitHub
    sourceCode, err := github.FetchRepository(deployment.RepoURL)
    if err != nil {
        // Log the error as usual
        log.Fatalf("Deployment failed: %v", err)
    }

    // Continue with deployment process...
}
Behind the scenes, Qpoint is capturing everything. When a GitHub API call fails, you'd see something like this in the Qpoint dashboard:
Request: GET https://api.github.com/repos/user/repo/contents
Headers: Authorization: token gho_xxxxxxxxxxxx
         Accept: application/vnd.github.v3+json

Response: 429 Too Many Requests
Headers: X-RateLimit-Limit: 5000
         X-RateLimit-Remaining: 0
         X-RateLimit-Reset: 1615148485
Body: {
  "message": "API rate limit exceeded for user ID 12345.",
  "documentation_url": "https://docs.github.com/rest/overview/resources-in-the-rest-api#rate-limiting"
}
The difference? With Qpoint, we'd immediately know:
- The exact HTTP error code (429 Too Many Requests)
- The complete error message in the response payload
- The rate limit headers showing when limits will reset
- Which specific process in our application made the call and on what system
- Whether this is happening to all GitHub API calls or just specific endpoints
Beyond Monitoring: The Operational Advantage
The power of Qpoint's approach goes beyond just identifying problems. It transforms how teams operate distributed systems in several key ways:
- Reduced MTTR (Mean Time to Resolution): By immediately pinpointing the source of failures, teams can resolve issues faster
- Elimination of "is it us or them?" debates: Clear evidence means less time debating and more time fixing
- Proactive detection: Spot issues before they become critical failures
- Resource optimization: Instead of building and maintaining custom monitoring, teams can focus on core business logic
Deploying Qpoint in Your Environment
Let's look at how you'd actually deploy Qpoint in a real environment. For a Docker-based deployment, it's as simple as:
docker run \
  --user 0:0 \
  --privileged \
  --cap-add CAP_BPF \
  --cap-add CAP_SYS_ADMIN \
  --pid=host \
  --network=host \
  -v /sys:/sys \
  -v /var/run/docker.sock:/var/run/docker.sock \
  -e TINI_SUBREAPER=1 \
  --ulimit=memlock=-1 \
  us-docker.pkg.dev/qpoint-edge/public/qpoint:v0 \
  tap \
  --log-level=info \
  --registration-token=$TOKEN
This might look like a lot of flags, but they're necessary to give Qtap the permissions it needs to attach to kernel functions and monitor connections outside of its container. If you're a Kubernetes shop, you'd typically deploy using Helm:
helm repo add qpoint https://helm.qpoint.io
helm install qpoint qpoint/qtap \
  --set registration.token=$TOKEN
You have two deployment options:
- Cloud Connected Mode: Managed by Qpoint's Control Plane using a registration token
- Local Only Mode: Self-contained deployment using a local configuration file
When building a globally distributed PaaS, having both options would have been crucial—we could start with Cloud Connected for ease of adoption, then potentially move to Local Only for sensitive environments.
The Architecture: Process-Aware Visibility
Let's feed two birds with one slice of bread here (as the more compassionate saying goes): we can both simplify our systems and improve reliability by adopting tools like Qpoint.
Here's how Qpoint's architecture works in practice:
What makes Qpoint particularly powerful is its approach to visibility:
- It sees actual data before encryption happens at the socket level
- It identifies exactly which processes are making each external call
- It maintains full service context throughout the connection lifecycle
- It captures all this data without requiring certificate management or application modifications
Beyond Monitoring: Real-World Examples
Let's look at some practical scenarios where Qpoint would have saved our team countless hours of troubleshooting:
Scenario 1: Intermittent 5xx Errors from an External API
Before Qpoint
- Alert fires: "High error rate on deployments"
- Check logs: "External API returned 503"
- Is it just us? Check status page (nothing reported)
- Run tests from different locations
- Create support ticket with vendor
- Wait hours for response...
- Eventually learn they're experiencing regional outages
With Qpoint
- Alert fires: "High error rate on deployments"
- Check Qpoint: See all 503 responses with bodies showing "Service temporarily unavailable in us-east"
- Notice pattern: All calls to specific endpoints failing in same region
- Implement immediate workaround: route traffic to different region
- Notify vendor with exact error details
Scenario 2: Authentication Failures
Before Qpoint
- Customer reports: "Can't deploy from my GitHub repo"
- Logs show: "Authentication failed"
- Is our token expired? Check token management system
- Is GitHub having auth issues? Check status page
- Is our integration broken? Review recent code changes
- Hours later: Discover GitHub changed their token format
With Qpoint
- Customer reports: "Can't deploy from my GitHub repo"
- Check Qpoint: See 401 responses with body showing "Token format deprecated, please migrate to new format"
- Update token format immediately
- Deploy fix within minutes
Conclusion
Building and operating complex distributed systems doesn't need to come with the burden of custom-built monitoring for every external dependency. Qpoint represents a fundamental shift in how we approach observability—moving beyond simple metrics and logs to provide comprehensive, contextual visibility into the entire dependency chain.
By leveraging eBPF technology to capture process-level details and actual payloads, Qpoint eliminates the guesswork and dramatically reduces troubleshooting time.
For teams operating in a "you build it, you run it" model, this isn't just a nice-to-have—it's a game-changer that allows engineers to:
- Focus on core business logic rather than building monitoring systems
- Identify root causes in minutes rather than hours
- Proactively detect problems before they impact users
- Make data-driven decisions about external service dependencies
The best part? All of this comes with minimal setup—a simple agent deployment—and zero changes to your application code.
If you want to take your API observability to the next level, I'd recommend starting a free trial of Qpoint at https://qpoint.io and seeing the difference for yourself.